

Helical Pile Industry Report 2026: Installers, Brands and Trends
Original data on 502 verified helical pile installers in the U.S. and Canada: counts by state, per-capita density, services, company age and brands.
Helical Pile USA lists 502 verified helical pile installers across the United States and Canada as of October 2026. Canada has 10.9% of the two countries' combined population but 36.1% of the listed installers, and three dealer networks (Techno Metal Post, GoliathTech and Ram Jack) account for 53.8% of them. This report breaks the directory down by state and province, population, services, company age and brand, using our own listing data plus Census Bureau and Statistics Canada population estimates.
Key takeaways
- Coverage: 502 verified installers: 321 in the U.S. and 181 in Canada. Ontario (57) and Quebec (52) alone hold 21.7% of the total.
- Density gap: Canada has 4.33 listed installers per million residents, 4.6 times the U.S. rate of 0.94.
- Underserved states: Illinois (0.24), Georgia (0.27), Nevada (0.3) and Iowa (0.31) have the fewest listed installers per million people among states with 3 million or more residents. The U.S. state median is 0.98.
- Services: 57.4% of installers list foundation repair and 53.6% list decks or light structures, but only 11.6% mention solar or energy work.
- Brands: 64.5% of installers have a known manufacturer affiliation. Techno Metal Post leads with 103 listed dealers, followed by GoliathTech (92) and Ram Jack (75).
What this report measures
The data comes from the Helical Pile USA installer directory. On October 8, 2026 it had 634 live company listings. Of these, 109 were flagged in our September 2026 listing review, so we excluded them from every count in this report. That leaves 525 verified listings. We also took out 16 manufacturer and 7 distributor listings, which leaves 502 installers (including foundation repair firms and commercial installers). Each of these companies was researched on its own website in September 2026 for its services, service area and founding year.
The 109 excluded listings fall into three review groups: 35 whose live website showed no helical work, 49 whose website was dead or parked, and 25 we could not verify. If they were included, the totals would be 411 U.S. and 196 Canadian installers. The state table shows both figures.
Where helical pile installers are located
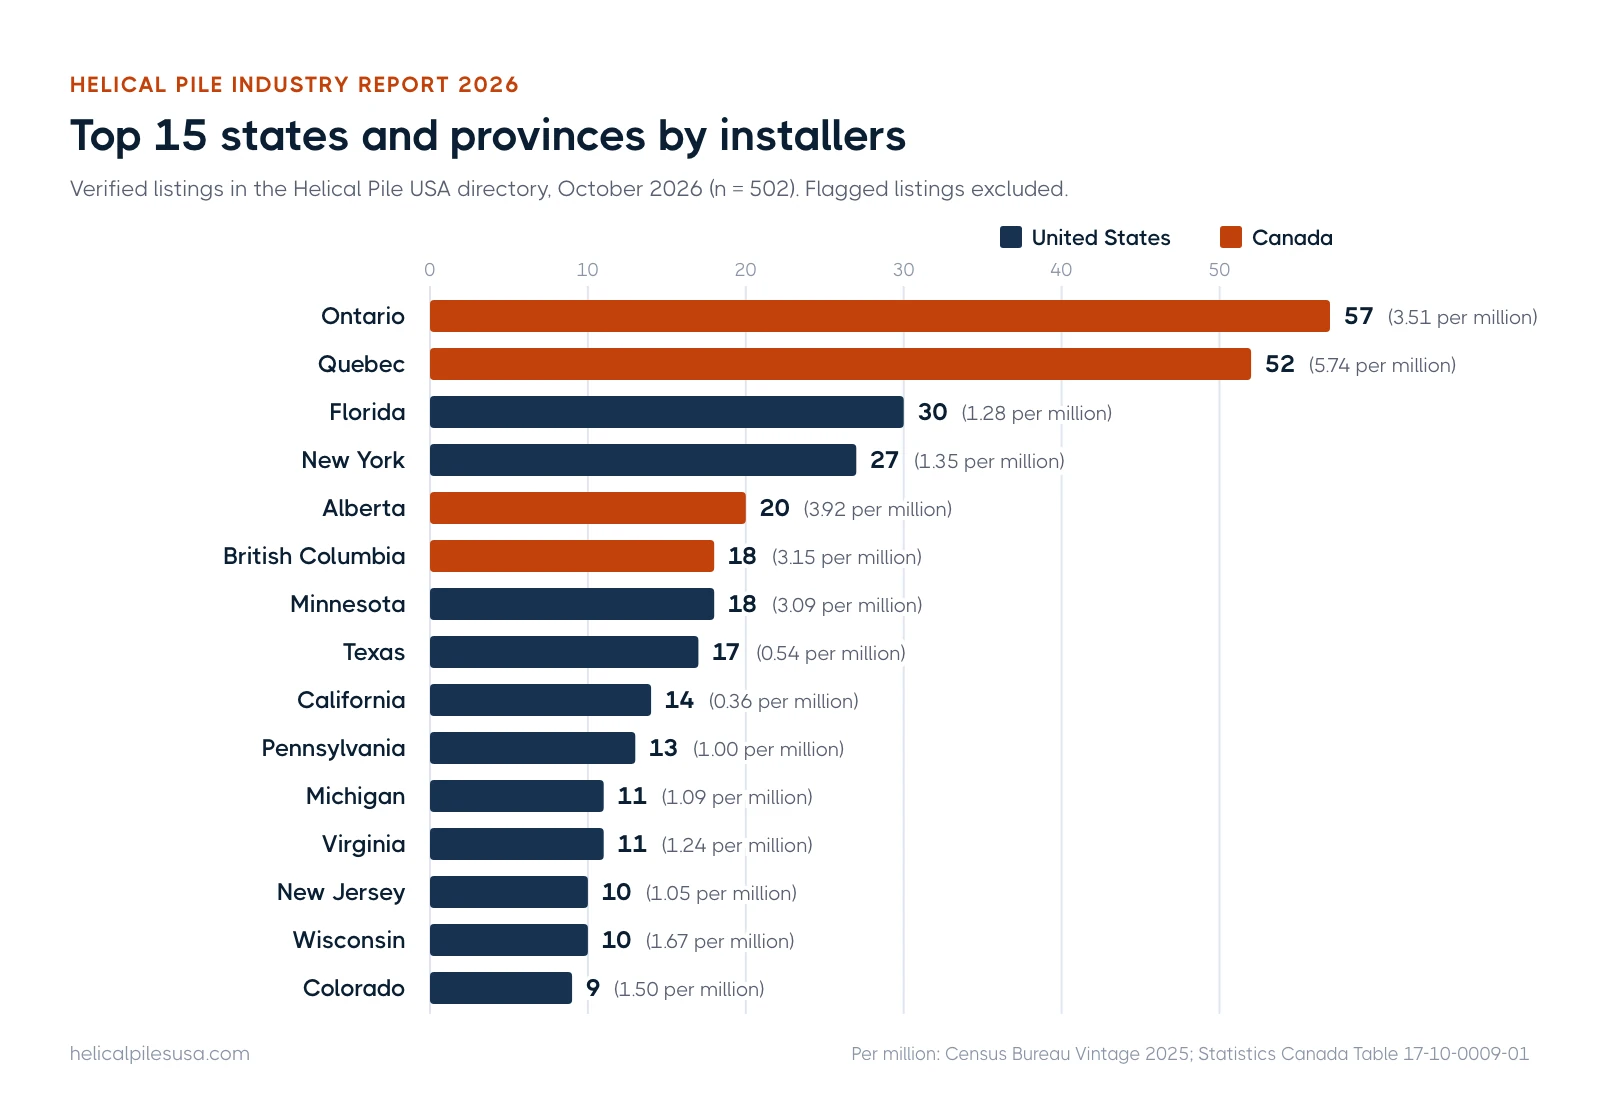
The 15 largest states and provinces hold 63.1% of all listed installers. Ontario and Quebec lead by a wide margin. That likely reflects the screw pile market for decks, additions and cottages in Canada's frost belt, and the home base of the large Quebec dealer networks. Florida and New York are the top U.S. states. 60 of the 64 states, provinces and territories we track have at least one verified installer.
| Rank | State or province | Country | Verified installers | Incl. flagged | Per million residents |
|---|---|---|---|---|---|
| 1 | Ontario | Canada | 57 | 63 | 3.51 |
| 2 | Quebec | Canada | 52 | 55 | 5.74 |
| 3 | Florida | U.S. | 30 | 37 | 1.28 |
| 4 | New York | U.S. | 27 | 30 | 1.35 |
| 5 | Alberta | Canada | 20 | 23 | 3.92 |
| 6 | British Columbia | Canada | 18 | 19 | 3.15 |
| 7 | Minnesota | U.S. | 18 | 20 | 3.09 |
| 8 | Texas | U.S. | 17 | 28 | 0.54 |
| 9 | California | U.S. | 14 | 24 | 0.36 |
| 10 | Pennsylvania | U.S. | 13 | 16 | 1.0 |
| 11 | Michigan | U.S. | 11 | 14 | 1.09 |
| 12 | Virginia | U.S. | 11 | 14 | 1.24 |
| 13 | New Jersey | U.S. | 10 | 12 | 1.05 |
| 14 | Wisconsin | U.S. | 10 | 13 | 1.67 |
| 15 | Colorado | U.S. | 9 | 10 | 1.5 |
United States vs Canada
| Country | Verified installers | Share of installers | Population | Installers per million |
|---|---|---|---|---|
| United States (50 states + DC) | 321 | 63.9% | 341,784,857 | 0.94 |
| Canada (provinces + territories) | 181 | 36.1% | 41,798,407 | 4.33 |
Population figures are the U.S. Census Bureau Vintage 2025 state estimates (July 1, 2025) and Statistics Canada Table 17-10-0009-01 (quarterly estimate for July 1, 2026).
Installers per million residents
Raw counts favor big states, so we also divided each jurisdiction's installer count by its population. Places with fewer than 1 million residents are left out of the ranking, because one listing there swings the ratio. That leaves 52 states and provinces. Montana ranks first. It has 9 listed installers for about 1.14 million people. 7 of the top ten are Canadian provinces.
| Highest density | Installers | Per million |
|---|---|---|
| Montana | 9 | 7.86 |
| Nova Scotia | 8 | 7.25 |
| Quebec | 52 | 5.74 |
| Manitoba | 7 | 4.61 |
| New Hampshire | 6 | 4.24 |
| Alberta | 20 | 3.92 |
| Ontario | 57 | 3.51 |
| British Columbia | 18 | 3.15 |
| Saskatchewan | 4 | 3.13 |
| Minnesota | 18 | 3.09 |
| Lowest density | Installers | Per million |
|---|---|---|
| Illinois | 3 | 0.24 |
| Georgia | 3 | 0.27 |
| Nevada | 1 | 0.3 |
| Iowa | 1 | 0.31 |
| Mississippi | 1 | 0.34 |
| California | 14 | 0.36 |
| Kentucky | 2 | 0.43 |
| Indiana | 3 | 0.43 |
| Maryland | 3 | 0.48 |
| Texas | 17 | 0.54 |
Underserved states
We call a state underserved when it has at least 3 million residents and fewer than half the U.S. state median of 0.98 listed installers per million. 8 states meet that test: Illinois (3 for 12.7 million), Georgia (3 for 11.3 million), Nevada (1 for 3.3 million), Iowa (1 for 3.2 million), California (14 for 39.4 million), Indiana (3 for 7.0 million), Kentucky (2 for 4.6 million), Maryland (3 for 6.3 million). 26 of the 51 U.S. jurisdictions (50 states plus DC) are below 1 installer per million. South Dakota and the District of Columbia have no verified listing at all. A low count means few installers are listed with us, not that none work there. Large regional dealers often serve these states from next door. For homeowners it still means fewer local bids to compare, so it pays to read how to hire a helical pile contractor before signing.
What installers offer: service mix
We sorted each company's researched services list (an average of 5.4 items) into ten categories using keywords. A company can fall into several categories, so the shares add up to more than 100%. All 502 installers had a services list. Commercial work scores high because many residential firms also list commercial or industrial jobs.
| Service category | All installers | U.S. | Canada |
|---|---|---|---|
| Commercial, industrial and infrastructure | 59.6% (299) | 51.7% | 73.5% |
| Foundation repair and underpinning | 57.4% (288) | 68.5% | 37.6% |
| Decks, porches and light structures | 53.6% (269) | 37.7% | 81.8% |
| New construction foundations | 52.2% (262) | 39.6% | 74.6% |
| Waterproofing and basements | 20.9% (105) | 29.6% | 5.5% |
| Engineering, design and testing | 20.9% (105) | 21.5% | 19.9% |
| Tiebacks, anchors and retaining walls | 14.9% (75) | 21.5% | 3.3% |
| Solar and energy | 11.6% (58) | 12.1% | 10.5% |
| Docks, boardwalks and marine | 8.0% (40) | 9.3% | 5.5% |
| Manufacturing, supply and rental | 8.0% (40) | 6.2% | 11.0% |
The two markets look different. In the U.S., 68.5% of installers list foundation repair and 29.6% list waterproofing or basement work. That is the foundation repair contractor model. In Canada, 81.8% list decks or light structures and 74.6% list new construction, which is the screw pile dealer model. Solar and energy work is a niche everywhere (12.1% U.S., 10.5% Canada), even though utility solar and battery storage capacity is growing fast (see the industry context below). Costs for these job types are covered in our helical pier cost guide and deck pile guide.
How old are helical pile companies?
A founding year was available for 110 of the 502 installers (n = 110). 58 came from the company's own website, and the rest came from the listing record. The median founding year is 1995, a median age of 31 years. The oldest is from 1939 and the newest from 2019. 63.6% have been in business 25 years or more.
| Founded | Companies | Share |
|---|---|---|
| Before 1980 | 18 | 16.4% |
| 1980-1999 | 52 | 47.3% |
| 2000-2009 | 17 | 15.5% |
| 2010-2014 | 13 | 11.8% |
| 2015-2019 | 10 | 9.1% |
| 2020 or later | 0 | 0.0% |
Treat this as a profile of established firms, not of the whole industry. Older companies are more likely to state a founding year, and a founding year often comes before the company started helical work. A concrete or excavation firm founded in the 1980s may have added helical piles much later. Newer dealer franchises rarely publish a founding date, so they are underrepresented here.
Manufacturer and brand affiliation
We linked an installer to a brand when the listing is a named dealer in that brand's network or appears on that manufacturer's dealer list in our directory. On that basis, 324 installers (64.5%) have a known brand, and 2 are linked to more than one. The other installers may use any brand, or several. See the helical pile manufacturers index for every profile.
| Manufacturer | Listed installers | U.S. | Canada | Share of all installers |
|---|---|---|---|---|
| Techno Metal Post | 103 | 42 | 61 | 20.5% |
| GoliathTech | 92 | 48 | 44 | 18.3% |
| Ram Jack | 75 | 72 | 3 | 14.9% |
| Hubbell CHANCE | 14 | 14 | 0 | 2.8% |
| Postech Screw Piles | 14 | 5 | 9 | 2.8% |
| IDEAL Foundation Systems | 4 | 3 | 1 | 0.8% |
| Almita Piling | 4 | 0 | 4 | 0.8% |
| Foundation Supportworks | 4 | 4 | 0 | 0.8% |
| US Helicals | 3 | 3 | 0 | 0.6% |
| TorcSill Foundations | 3 | 3 | 0 | 0.6% |
The three franchise or dealer networks dominate: 270 installers (53.8%) belong to Techno Metal Post, GoliathTech or Ram Jack. Their footprints differ. Ram Jack is almost entirely American (72 U.S., 3 Canada). Techno Metal Post leans Canadian (61 of 103), and GoliathTech is close to evenly split. Engineered brands sold through distributors, such as Hubbell CHANCE, Foundation Supportworks and MacLean Civil Products, show smaller counts. Contractors who buy through distributors do not always name the brand on their websites, so these counts are a floor, not market share.
Industry context: what changed in 2026
Several 2026 events matter for supply, ownership and demand. All are summarized in our helical pile news feed with links to the original sources.
- GoliathTech builds U.S. capacity: In a January 21, 2026 release, the Quebec company said it will open a manufacturing plant in Ohio, citing new U.S. tariffs. It said its franchisees are present in 33 U.S. states. See our news summary.
- MacLean Power Systems buys Delta Star: On September 1, 2026, the parent of MacLean Civil Products signed agreements to acquire Delta Star, a Lynchburg, Virginia maker of power transformers and mobile substations. Closing is expected in the fourth quarter of 2026 and terms were not disclosed. The deal deepens the company's position in the utility market where its helical anchors are sold (our summary).
- DFI recognition: The Deep Foundations Institute named Magnum Piering's Howard Perko its 2026-2027 Traveling Lecturer and gave its 2026 Outstanding Project Award to the Irishtown Bend slope stabilization in Cleveland. Its 51st Annual Conference runs November 2 to 5, 2026 in Orlando.
- Solar and battery storage demand: The U.S. Energy Information Administration reported that developers planned 86 GW of new utility-scale capacity in 2026, including 43.4 GW of solar (51%) and 24 GW of battery storage (28%), after a record 15 GW of batteries in 2025. A later EIA update put operating battery capacity at 43.6 GW at the end of 2025, with 8.3 GW more added in the first half of 2026. Helical makers are winning that work: Cyntech supplied more than 1,000 helical piles for a Southwest battery storage project. Our solar helical pile guide covers the foundation side.
Set against our directory data, the solar and storage numbers point to a gap. Only 58 of 502 listed installers mention solar or energy work, which suggests large energy foundation work is concentrated in a small group of specialist and manufacturer-installer firms.
Using this data to find an installer
Start with your state or province page in the installer directory. Each page lists the verified companies and the local soil and frost conditions. If your state is on the underserved list, ask out-of-state dealers whether they travel, and get at least two bids. Our free helical pile tools help you estimate pile counts and costs before you call.
Methodology and limitations
- Not a census: The directory covers companies we have found and verified. It is not a complete count of every firm that installs helical piles. Counts show directory coverage, which is deepest where dealer networks publish locator pages.
- Population of listings: Live (published, not draft or archived) installer listings on October 8, 2026 (634). We excluded 109 listings flagged in the September 2026 review (35 no helical evidence, 49 dead or parked site, 25 unverifiable), and then 16 manufacturer and 7 distributor listings.
- Location: Each listing counts once, in its home state or province. Companies that serve several states are counted only where they are based.
- Per million: Installers divided by population, times one million. U.S. figures use Census Vintage 2025 (July 1, 2025) for the 50 states and DC. Puerto Rico is not covered by the directory. Canadian figures use Statistics Canada's July 1, 2026 estimate. Rankings exclude jurisdictions under 1 million residents.
- Service mix: Keyword matching on each company's researched services list. For example, "underpin", "pier and beam" or "concrete lifting" count as foundation repair, and "deck", "porch", "sunroom" or "carport" count as decks and light structures. 14 installers matched none of the ten categories (usually a generic "helical piles" entry). Dealer networks use similar service lists, which raises the shares for their core services.
- Company age: The founding year comes from the company's website where stated, otherwise from the listing record. n = 110.
- Brands: Network dealer type plus manufacturer dealer lists in our directory. Unbranded installers are not assigned a brand.
The analysis script and the output tables (CSV) are kept by the Helical Pile USA editorial team, and we will rerun them for future editions.
How to cite this report
Helical Pile USA, Helical Pile Industry Report 2026, helicalpilesusa.com. Please link to this page when you reuse a table or figure.
Frequently asked questions
How many helical pile installers are there in the U.S. and Canada?
Our directory lists 502 verified installers: 321 in the U.S. and 181 in Canada. The real number is higher, because no directory captures every contractor.
Which state has the most helical pile installers?
Among U.S. states, Florida (30) and New York (27) have the most verified listings. Across both countries, Ontario and Quebec lead.
Which brand has the most installers?
Techno Metal Post has the most listed dealers (103), followed by GoliathTech (92) and Ram Jack (75).
Where is it hardest to find a helical pile installer?
By installers per million residents, Illinois, Georgia and Nevada rank lowest among states with 3 million or more people. South Dakota and the District of Columbia have no verified listing.
Can I use these figures in my own article?
Yes. Cite "Helical Pile USA, Helical Pile Industry Report 2026, helicalpilesusa.com" and link to this page.
Last reviewed October 2026 by the Helical Pile USA editorial team. Found an error? Tell us.
Subscribe to our weekly email newsletter
Industry news, featured projects, new products, and installer spotlights from across the helical pile industry, delivered to your inbox.


Latest articles

Get the Helical Pile Industry Brief
New installers, manufacturer news, cost updates, and fresh guides for the U.S. and Canadian helical pile industry. Short, occasional emails. Unsubscribe any time.
